Link: https://www.kaggle.com/c/g-research-crypto-forecasting
Problem Type: Time Series
Input: the price, volume, OHLC and num trades in that time interval (a minute)
- NOTE: you do not get the candlestick charts. You only get aggregate time series data for each minute
Output: 15 minute residualized returns
Eval Metric: Your (forecasted returns) - (actual market returns)
- here the returns are logged
- it’s calculated by: log(price in current time step / price in previous time step)
- the market returns are the weighted sums of each asset’s returns (each asset gets a diff weight)
- more details here: https://www.kaggle.com/code/cstein06/tutorial-to-the-g-research-crypto-competition/notebook
Summary
Important notebooks/discussions
- https://www.kaggle.com/code/cstein06/tutorial-to-the-g-research-crypto-competition/notebook
- log returns are preferred for mathematical modelling of time series
- cause they are additive across time
- and they are not bounded (regular returns cannot go below -100%)
- you just log the return to calculate this (diff between curr price and the prev price)
- there is high but variable correlation between the price of BTC and ETH
- we want to work with constant mean, variance, and autocorrelation variables
- since these are stationary distributions, and we can use forecasting techniques on it
- use StandardScaler and fit_transform your input/output feats (cause regression models care about being in the proper scale)
- log returns are preferred for mathematical modelling of time series
- https://www.kaggle.com/code/jagofc/detailed-local-api-introduction/notebook
- this local api module allows you to emulate the
gresearch_cryptotimeseries API locally (so you can submit to the public LB)
- this local api module allows you to emulate the
Solutions
-
(2nd) lgbm
- https://www.kaggle.com/competitions/g-research-crypto-forecasting/discussion/323098
- “I’ll strive to provide insight into my methods, but without giving away model details that could be profitable for the host”
-
Crossvalidation
- there were around 200 weeks of data
- used 6-fold, walk-forward, grouped cross validation
- the group key was the timestamp
- train folds were 40 weeks long
- test folds were 40 weeks long
- there was a gap of 1 week between test and train folds
- “the ends of training folds were incremented by 20 weeks each fold.”
- this sentence make me believe it’s forward chaining cross validation
- I chose to overlap my folds so that they could be long, but I could still have 6 folds.
- more folds = less variance
- I think he averaged these folds since they say “the average CV scores”
- didn’t change seeds cause the CV score variance was low enough (and CV was getting too slow)
- With no gap, a model can cheat at the the beginning of the test period, because the end of the train period is very similar.
- There was no gap between train and test data in the final submission.
- so train up to the last data point!
- There was no gap between train and test data in the final submission.
-
feature engineering
- they were very private about this because the competition host wouldn’t make alpha
- they definitely tried everything (e.g. making one model for all coints - the coin is a feature)
- “Timeseries learning is essentially supervised learning that respects causality.” (cause it all depends on past data)
- I assume that they used the output arima predictions as features for the lgbm model
- they were very private about this because the competition host wouldn’t make alpha
-
models
- LightGBM with squared loss
- There was no ensembling other than the gradient boosting in GBDT.
- The only parameters I changed from defaults were the number of estimators, number of leaves, and the learning rate
- no regularization, augmentation, or feature neutralization
- it didn’t help CV
- I wanted to train with the entire dataset, because CV had shown me that scores just kept improving with longer training data
- this is interesting. it suggests that limiting to only the last x weeks of data doesn’t perform better than using all data (no domain drift)
- df.update() caused lots of unnecessary RAM copies of arrays
- LightGBM with squared loss
-
(3rd) simple feature engineering, only lgbm
- https://www.kaggle.com/competitions/g-research-crypto-forecasting/discussion/323703
- solution code
- CV was EmbargoCV from this notebook: https://www.kaggle.com/code/nrcjea001/lgbm-embargocv-weightedpearson-lagtarget/
- someone just manually split the training dat ainto folds, but Im not sure how they did it (the folds weren’t specified in the notebook)
- training data selection
- since they expected that data would NOT be missing during the eval stage, they decided to use the training data from the period when there were enough currencies present. data period selection
- The selection of the starting date was done by looking at the CV scores. However, this was a mistake in hindsight, since it meant that I was comparing CV scores across different data.
- then what is a better way to choose this start date?
- probably to look at the distribution that is missing data in the training set and select the period that has the least?
- Note: I think that it’s best to NOT have missing data during training (but it’s ok to have it during inference) since for training we want to have the best signal. (and for data to be missing isn’t an expected case)
- filling training data (impute data)
- many coins had long periods where they were missing data
- “I attempted forward fill to prevent missing data as a result of rolling”
- but they thought that forward filling would “cause a decline in data quality when there is a long blank period, so I set a limit on forward fill”
- “In the evaluation phase, the code was designed to have forward fill without a limit, but I thought this would not be a problem since there are no long blank periods in the evaluation phase.”
- many coins had long periods where they were missing data
- features
- Only ‘Close’ is used.
- Since I thought that memory and inference time would become more demanding with this kind of processing, I reduced the amount of data to be used.
- they thought that close was the most important
- I prepared two features for multiple lag periods:
- log(close / avg price in the period)
- log(close / close a certain period ago)
- their code is much more specific
- For these, I took the average for all currencies
- (Due to missing data, no weighted averaging was performed)
- I guess this makes sense. cause if you do a weighted average on generated data, then you could be over-indexing on synthetic data (if that currency was BTC - since it has a higher weight than all other)
- another feature: current currency price - average price of all currencies
- (not sure if weighted average)
- Only ‘Close’ is used.
-
(7th) only modelling. the only feature added was time of day
- the final submission is an ensemble of 4 models trained with different sequence lengths.
- they probably mean different periods of data?
- for the image below, it looks like the minutes 90 is just the last 90 minutes of data right before the current time?
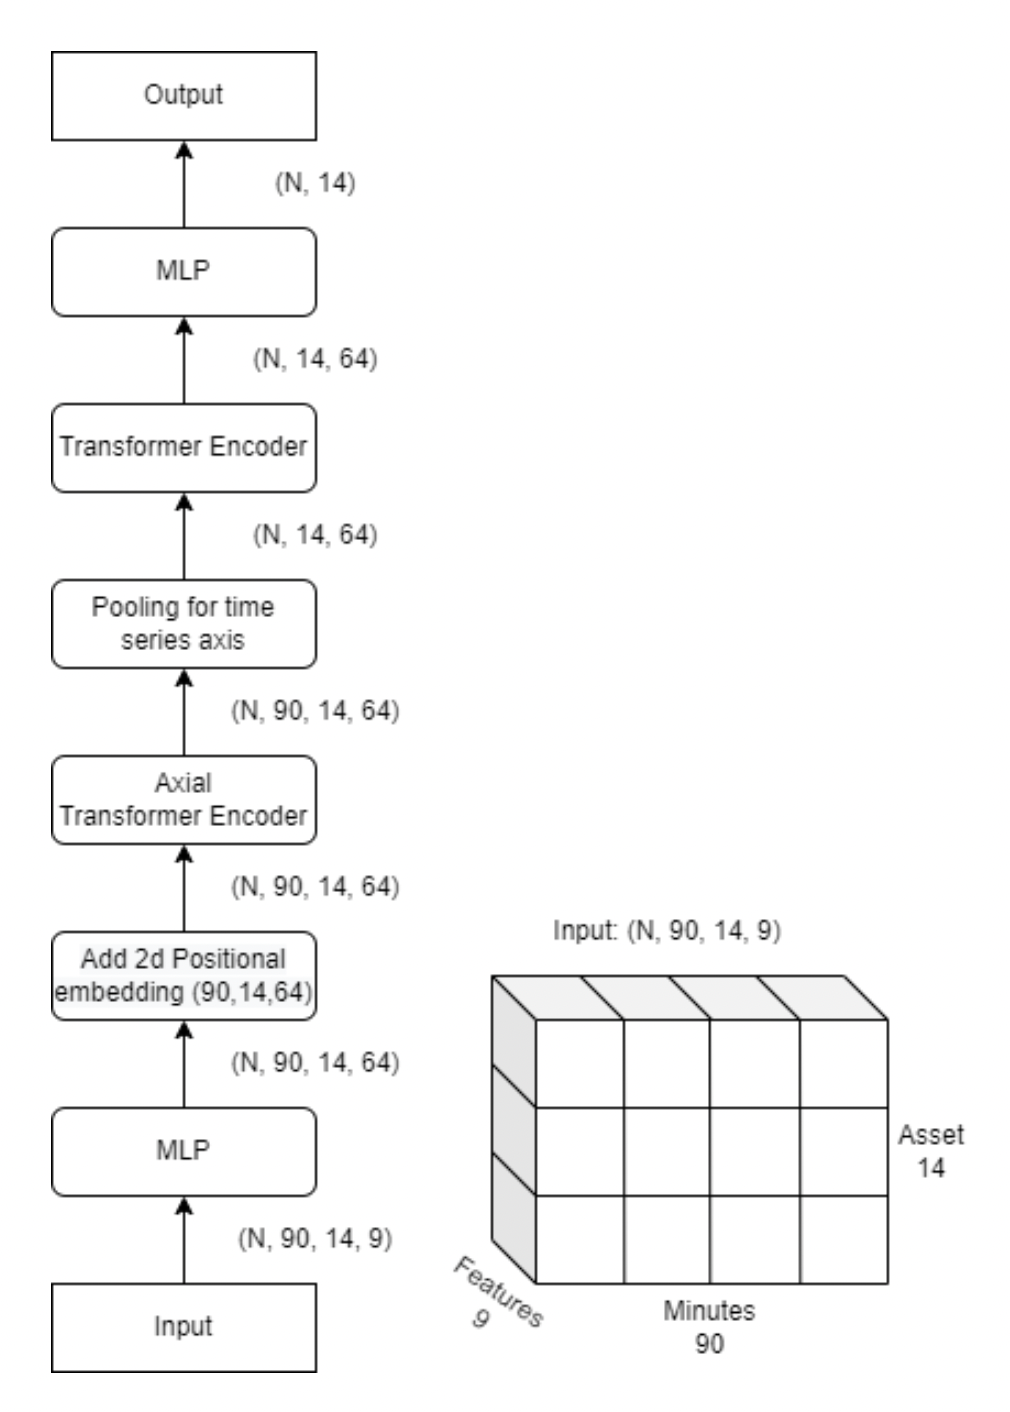
- axial attention
- the final submission is an ensemble of 4 models trained with different sequence lengths.
-
(9th) feature engineering expert models lgbm
- https://www.kaggle.com/competitions/g-research-crypto-forecasting/discussion/324180
- inference solution code: https://www.kaggle.com/code/bturan19/lgb-3fold-rollingagg-lagtarget-submissioninference/notebook
- the hull moving average was their most important feature
- https://www.motivewave.com/studies/hull_moving_average.htm
- “The Hull Moving Average makes a moving average more responsive while maintaining a curve smoothness.”
- I choose my windows with a Fibonacci sequence:
fibo_list = [55, 210, 340, 890, 3750]Fibonacci window lag
- https://www.motivewave.com/studies/hull_moving_average.htm
- I have 3 different LightGBM models that were trained for different market conditions. Up market, down market and relatively more stable market. Then I get the average of them. expert models
- they only made 3 models. they used the same 3 models to predict for each asset
- Note: the model doesn’t see the data for all assets at once. it just predicts per-asset
Takeaways
- feature engineering is so important
- you can get very far with basic gradient boosted tree models