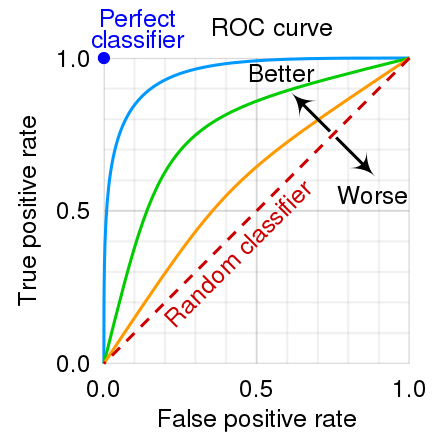
- It’s used to illustrate the performance of a binary classifier model
- receiver operating characteristic curve
- it’s the plot of the true positive rate (TPR = TP / (TP + FN)) against the false positive rate (FPR = FP / (FP + TN)) at each threshold setting.
- Basically, we iterate through different threshold settings and say: “for this threshold, how many points are TP, and how many points are FP”
- then we plot a point on the graph like that
- finally, we smoothen all the points
- to get the area under the curve, we need the actual predictions (can’t do it using summarized statistics like num TP num FP)